top of page

Search


Callum Thomas
Aug 7, 20172 min read
ChartCritic 4 - Investor Confidence Index
As I was doing my weekly S&P500 #ChartStorm on Twitter a rather interesting chart caught my attention. It was one of the series from the...
362 views0 comments

Callum Thomas
Aug 2, 20171 min read
ChartBrief 124 - NYSE Margin Debt Update
The latest NYSE margin debt data was just released (for June - yes it gets released with a 1-month lag... which by the way reduces its...
383 views0 comments

Callum Thomas
Jul 30, 20172 min read
Weekly Sentiment Poll: Fundamentals
The latest weekly sentiment poll on Twitter showed a couple of very interesting trends in sentiment and markets. As a reminder the...
110 views0 comments

Callum Thomas
Jul 30, 20171 min read
ChartBrief 121 - Euphoriameter moves into a new phase
The Euphoriameter rose again in July, with the combined sentiment reading for the S&P500 lifted by rising forward PE ratios, a low VIX,...
417 views0 comments

Callum Thomas
Jul 27, 20172 min read
ChartBrief 118 - Volatility bets hanging on
As equity market implied volatility grinds lower it's worth throwing a couple more charts into the mix. In this post we look at ETF bets...
65 views0 comments

Callum Thomas
Jul 25, 20172 min read
ChartBrief 116 - Institutional investor capitulation
The latest State Street Investor Confidence Index data for July showed a distinct sense of upside capitulation (by North American...
100 views0 comments

Callum Thomas
Jul 19, 20172 min read
ChartBrief 112 - The stockmarket season is changing
Following on from the popular post on the seasonal turning point for the VIX last week, here's an insight into seasonality for the S&P500...
472 views0 comments

Callum Thomas
Jul 15, 20172 min read
ChartBrief 109 - The big swings in commodity futures positioning
Here's a quick update on commodity futures positioning with the latest weekly CFTC COT report data. I've just picked out what I think...
213 views0 comments

Callum Thomas
Jul 14, 20172 min read
ChartBrief 108 - Global bond market breakdown
After the big reflation reset in positioning, global bond markets are showing more signs of breaking down. We previously talked in detail...
170 views0 comments

Callum Thomas
Jul 12, 20172 min read
ChartBrief 105 - The VIX is at a Seasonal Turning Point
The topic of seasonality is a controversial one among investors. Some swear by it, referring to studies that present evidence for a...
612 views0 comments
Topdown Charts
Jul 12, 20171 min read
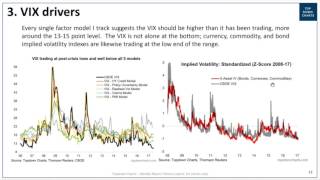
VIDEO: The VIX Drivers and Outlook
In this video we discuss the the drivers of the CBOE Volatility Index (VIX) and assess the outlook and possibility for VIX spikes based...
66 views0 comments

Callum Thomas
Jul 9, 20172 min read
ChartBrief 101 - Fundamental sentiment and clues from the bond market
The latest weekly equity (and bonds) sentiment poll I take on Twitter has produced some interesting results this week. I have done this...
61 views0 comments

Callum Thomas
Jul 3, 20172 min read
Investor Sentiment Snapshot: Divergences
The latest weekly investor sentiment poll on twitter showed up a couple of interesting divergences that may offer clues on the next steps...
51 views0 comments

Callum Thomas
Jun 21, 20172 min read
ChartBrief 87 - 2 Crude Oil tactical indicators to keep front of mind
In the latest edition of the Weekly Macro Themes report we talked about the likelihood of further short-term downside in the oil price...
304 views0 comments

Callum Thomas
Apr 29, 20171 min read
ChartBrief 74 - Commodities have bad breadth
Commodity market breadth measures show a market that looks vulnerable. The below charts apply market breadth measures to the GSCI (Light...
166 views0 comments


Callum Thomas
Apr 5, 20171 min read
ChartBrief 68 - A new bull market in Silver?
Probably a lot of people look at the longer term chart of silver and the first thing they see is the massive bull market that peaked in...
137 views0 comments
Topdown Charts
Apr 4, 20171 min read
Macro Technicals Report - Changing seasons and impending breakouts…
The Macro Technicals Report brings you 5 ideas each week from a top-down, cross-asset, global perspective. The report highlights some of...
453 views0 comments


Callum Thomas
Mar 29, 20172 min read
ChartBrief 66 - The Implications of Implied Correlations
As the recent selloff in the S&P 500 looks to be over before it really even got started, I thought it would be worth highlighting an...
172 views0 comments
Topdown Charts
Mar 28, 20171 min read
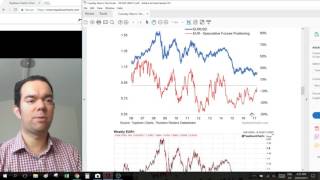
VIDEO: EURUSD - The turning tides
In this video we look at a couple of charts on the EURUSD exchange rate that show something really quite interesting is going on in this...
73 views0 comments
Topdown Charts
Mar 28, 20171 min read
Tuesday Macro Technicals Report - 28 Mar 2017
The Tuesday Macro Technicals report brings you 5 different ideas each week from a top-down, cross-asset, global, go-anywhere perspective....
216 views0 comments
bottom of page