top of page

Search

ChartBrief 192 - Institutional Investors Buying the Dip
The latest round of data from the State Street Investor Confidence Index [SSICI] appeared to show global institutional investors "buying...
Callum Thomas
Feb 28, 20182 min read
124 views
0 comments

ChartBrief 190 - Global Equities Breadth Check
With the rather volatile action in global equities over the past few weeks, it's worth checking in on where market breadth is tracking. ...
Callum Thomas
Feb 26, 20182 min read
170 views
0 comments

Weekly S&P500 #ChartStorm - 25 Feb 2018
Those that follow my personal account on Twitter will be familiar with my weekly S&P500 #ChartStorm in which I pick out 10 charts on the...
Callum Thomas
Feb 25, 20186 min read
207 views
0 comments

ChartBrief 187 - Bond Market Seasonality
Most investors are fairly familiar with the concept of seasonality in the stockmarket, with aphorisms such as "sell in May" baked into...
Callum Thomas
Feb 20, 20182 min read
656 views
0 comments

Implied Correlation Index Flashes a Buy Signal
I've talked about the CBOE implied correlation index a few times before, but it's very timely to revisit this indicator as the February...
Callum Thomas
Feb 19, 20182 min read
227 views
0 comments

Sentiment Snapshot: Meltdown?
A few weeks ago I wrote a report outlining the sentiment snapshot for markets, the theme was "melt up" as a number of sentiment...
Callum Thomas
Feb 5, 20184 min read
206 views
0 comments

ChartBrief 180 - On Bulls and Bears
Studying sentiment surveys can help not only in short-term stockmarket timing decisions, but also in understanding the broader mood of...
Callum Thomas
Jan 17, 20182 min read
633 views
0 comments

Sentiment Snapshot: Did somebody say Melt-Up?
I had to think a bit before going with that title. The term "melt-up" is an increasingly overused word, and given this article features...
Callum Thomas
Jan 15, 20183 min read
1,415 views
0 comments

ChartBrief 178 - Market Seasonality Maps
Another year another datapoint... Regular readers will be familiar with the first chart which shows the average daily returns for the...
Callum Thomas
Jan 10, 20183 min read
339 views
0 comments

Sentiment Survey: Furious Bulls
The latest weekly sentiment/positioning survey on Twitter revealed a continuation of some very interesting trends and a new record in...
Callum Thomas
Jan 7, 20182 min read
183 views
0 comments

The Charts to Watch in 2018
I spent a lot of time in the 2017 End of Year Special Edition looking back across 2017. I covered some of my best charts and...
Callum Thomas
Jan 1, 20183 min read
954 views
0 comments

Global Equities Have Bad Breadth
Global equities can do little wrong lately, with falling volatility, improving earnings, and an almost straight-line upward march in the...
Callum Thomas
Dec 18, 20172 min read
170 views
0 comments

Expect more volatility?
Globally equity volatility is low. For that matter, volatility (both implied and realized) is low across the major asset classes. But...
Callum Thomas
Dec 11, 20172 min read
221 views
0 comments

ChartBrief 169 - December seasonality and the "Santa Claus rally"
The "Santa Claus rally" refers to the tendency for the S&P500 to do well in December, and specifically the last part of December. We can...
Callum Thomas
Dec 2, 20172 min read
306 views
0 comments

ChartBrief 168 - Institutional investors are selling global equities into strength
For the second month in a row the State Street Investor Confidence Index came in below 100 (the index uses State Street's global...
Callum Thomas
Nov 28, 20172 min read
307 views
0 comments

ChartBrief 167 - The Extraordinary Plunge in Stockmarket Volatility
Regular readers and followers on social media will be familiar with this chart, but what will probably be surprising is how this...
Callum Thomas
Nov 27, 20172 min read
240 views
0 comments
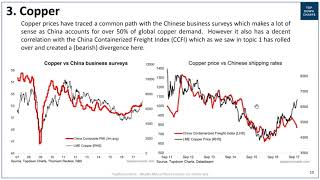
VIDEO: The Upside-Down of Copper
In this video we look at the conflicting views on the medium term vs short term outlook for Copper. Specifically, the video walks you...
Topdown Charts
Nov 14, 20171 min read
95 views
0 comments

Do you believe the oil hype?
The geopolitical backdrop in the Middle East is fluid to say the least, and this fluidity has helped the black fluid undertake what is...
Callum Thomas
Nov 14, 20172 min read
514 views
0 comments
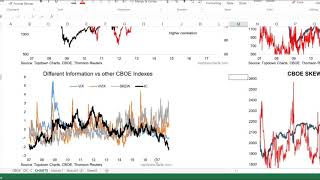
VIDEO: Implied Correlations and the Death of RO-RO
In this video we look at the CBOE Implied Correlation Index and the general evolution of correlations for the S&P500 and what it means...
Topdown Charts
Nov 7, 20171 min read
91 views
0 comments

ChartBrief 162 - Stockmarket Sentiment Surges
Funny things can happen when you mix human psychology with greed and constant stimulus. The seemingly straight-line march upward in the...
Callum Thomas
Oct 27, 20172 min read
227 views
0 comments
bottom of page