top of page

Search

ChartBrief 149 - A New Extreme in Volatility
The last time I reviewed this chart I pondered the possibility of a turning point or the start of a regime change for volatility... this...
Callum Thomas
Sep 20, 20172 min read
616 views
0 comments
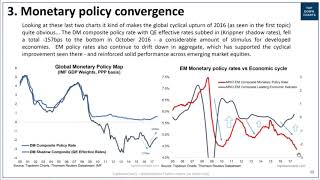
VIDEO: Global Monetary Policy Convergence
In this video we look at the topic of Global Monetary Policy Convergence. Specifically, the video walks through a couple of slides of a...
Topdown Charts
Sep 19, 20171 min read
66 views
0 comments

ChartBrief 148 - Chinese property price boom has topped out
The August data showed a further slowing of China's property price boom, and early signs that a slowdown if not a downturn could be on...
Callum Thomas
Sep 19, 20172 min read
174 views
0 comments

Global monetary policy convergence
The big focus this week is on whether the Fed will either hike rates, announce Quantitative Tighening (QT) aka balance sheet...
Callum Thomas
Sep 18, 20172 min read
107 views
0 comments

ChartBrief 147 - Global consumer sentiment rises as global equities hit new highs
The September readings of the Ipsos Consumer Sentiment surveys showed the GDP weighted global composite rebounding firmly to new highs -...
Callum Thomas
Sep 17, 20172 min read
85 views
0 comments
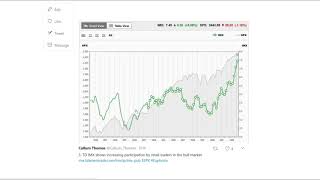
VIDEO: Weekly S&P500 ChartStorm 17 Sep 2017
Followers on Twitter will be familiar with the weekly S&P500 #ChartStorm - a selection of charts from around the web on US equity...
Callum Thomas
Sep 17, 20171 min read
24 views
0 comments
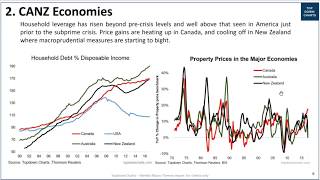
VIDEO: The CANZ economies
In this video we look at the "CANZ economies" (Canada, Australia, and New Zealand) and the implications of them all sharing a common...
Topdown Charts
Sep 12, 20171 min read
38 views
0 comments

Economic noise striking a cautionary tone
This article discusses an unusual but interesting indicator I designed to gauge the background economic noise emanating from an economy...
Callum Thomas
Sep 11, 20172 min read
164 views
0 comments

ChartBrief 145 - The Reemergence of Emerging Markets
Going through the latest numbers from the OECD Composite Leading Indicators data set I thought it would be worth sharing a couple of what...
Callum Thomas
Sep 11, 20172 min read
175 views
0 comments

5 Charts on Chinese Inflation Trends
The August inflation numbers for China have just been released, so it's a good opportunity to dust off a number of the Chinese inflation...
Callum Thomas
Sep 9, 20173 min read
238 views
0 comments
Weekly Macro Themes - 8 Sep 2017
Here's a brief preview of the topics and charts covered in the latest edition of the Weekly Macro Themes report. To read more and see the...
Topdown Charts
Sep 8, 20172 min read
105 views
0 comments

ChartBrief 143 - Canada hikes again - what does it mean for the "CANZ economies"?
The Bank of Canada hiked interest rates another 25bps to 1.00% today, surprising most. As noted last time (following the July interest...
Callum Thomas
Sep 6, 20172 min read
77 views
0 comments
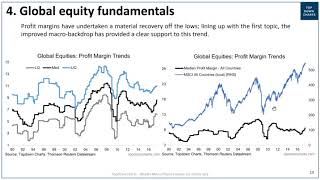
VIDEO: Global equity fundamentals and the "Mini-Recession"
In this video we look at the key trends in global equity fundamentals. The video walks through a couple of slides of a recent edition of...
Topdown Charts
Sep 6, 20171 min read
66 views
0 comments

The implications of low implied correlations
In this article we take another look at a somewhat obscure indicator "implied correlations". The Implied Correlation Index comes from...
Callum Thomas
Sep 4, 20172 min read
890 views
0 comments

ChartBrief 141 - Global manufacturing muddling through
The August round of manufacturing PMIs at an aggregate level showed a trend of muddling through. But it was a different type of muddling...
Callum Thomas
Sep 4, 20172 min read
103 views
0 comments

ChartBrief 139 - China PMI vs Dr Copper
The August round of official PMI data from China showed some mixed signals, and a little bit of something for everyone, but overall a...
Callum Thomas
Aug 31, 20172 min read
93 views
0 comments

ChartBrief 138 - Euphoria Peak
The August reading of the "Euphoriameter" showed a small but noticeable move down from what was a more than 12-year high, certainly a...
Callum Thomas
Aug 30, 20172 min read
112 views
0 comments

ChartBrief 136 - A flash signal for bonds
The August round of flash manufacturing PMIs saw the composite DM flash PMI basically unchanged. This was the product of stronger...
Callum Thomas
Aug 23, 20172 min read
179 views
0 comments

ChartBrief 135 - The top 10 PE10
Here's a quick scan across countries and regions to find the top (and bottom) PE10. The PE10 is a stock market valuation metric which...
Callum Thomas
Aug 21, 20172 min read
518 views
0 comments

ChartBrief 134 - Volatility regime change?
You have to look very closely at the chart, but our alternative measure of volatility has turned up... i.e. the rolling annual count of...
Callum Thomas
Aug 19, 20172 min read
282 views
0 comments
bottom of page