top of page

Search

ChartBrief 196 - Seasonal Surge
As investors pore over multitudes of data and factors, exploring lofty valuation metrics, swings in investor sentiment, trends and...
Callum Thomas
Mar 14, 20182 min read
308 views
0 comments
VIDEO: Top 5 Charts of the Week
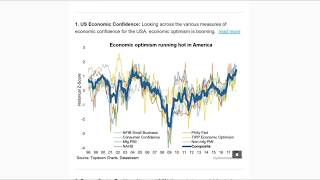
In this video we run through the weekly email newsletter "The Top 5 Charts of the Week". In this week's edition we look at US economic...
Topdown Charts
Mar 13, 20181 min read
68 views
0 comments

Weekly S&P500 #ChartStorm - 11 Mar 2018
Those that follow my personal account on Twitter will be familiar with my weekly S&P 500 #ChartStorm in which I pick out 10 charts on the...
Callum Thomas
Mar 10, 20186 min read
772 views
0 comments

ChartBrief 195 - OECD Leading Indicators at a Turning Point
The latest round of OECD Composite Leading Indicators was just released, and given how useful these indicators can be in shedding light...
Callum Thomas
Mar 10, 20182 min read
481 views
0 comments

Chart Of The Week: China Property Outlook
This week the "Chart of the Week" is focused on the outlook for China's property market. The Chinese property market is perhaps one of...
Callum Thomas
Mar 5, 20181 min read
463 views
0 comments

Weekly S&P 500 #ChartStorm - 4 Mar 2018
Those that follow my personal account on Twitter will be familiar with my weekly S&P 500 #ChartStorm in which I pick out 10 charts on the...
Callum Thomas
Mar 3, 20186 min read
239 views
0 comments

ChartBrief 193 - The Return of Volatility (Part 2)
A few weeks ago I wrote an article called "The Return of Volatility" in the midst of the February stock market correction. I highlighted...
Callum Thomas
Mar 3, 20183 min read
753 views
0 comments
VIDEO: Monetary Policy and Asset Allocation
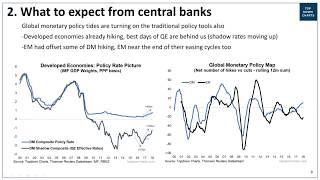
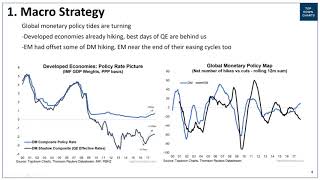
In this video we talk through the global monetary policy outlook and how it ties in with asset allocation. Monetary policy has been a...
Topdown Charts
Mar 1, 20181 min read
81 views
0 comments

ChartBrief 192 - Institutional Investors Buying the Dip
The latest round of data from the State Street Investor Confidence Index [SSICI] appeared to show global institutional investors "buying...
Callum Thomas
Feb 28, 20182 min read
124 views
0 comments

Treasuries: Too Far Too Fast?
Since the September low point last year US 10-Year bond yields have risen 90bps, this compares to 125bps from the low point in July 2016...
Callum Thomas
Feb 27, 20182 min read
202 views
0 comments

Weekly S&P500 #ChartStorm - 25 Feb 2018
Those that follow my personal account on Twitter will be familiar with my weekly S&P500 #ChartStorm in which I pick out 10 charts on the...
Callum Thomas
Feb 25, 20186 min read
207 views
0 comments

ChartBrief 189 - Global Trade Update
A few data points have come out on global trade over the past week so it's worth taking a look at what has been a really key theme for...
Callum Thomas
Feb 23, 20183 min read
236 views
0 comments

ChartBrief 188 - DM Mfg PMIs and UST 10Y
In case you didn't get that, it's Developed Markets manufacturing PMI (Purchasing Managers Index) and US 10-Year government bond yields. ...
Callum Thomas
Feb 21, 20182 min read
130 views
0 comments

Implied Correlation Index Flashes a Buy Signal
I've talked about the CBOE implied correlation index a few times before, but it's very timely to revisit this indicator as the February...
Callum Thomas
Feb 19, 20182 min read
227 views
0 comments

Cyclicals vs Defensives - the next shoe to drop?
The February stockmarket correction has investors scrambling to find the reason behind the rapid fall in the major indexes, with various...
Callum Thomas
Feb 13, 20182 min read
370 views
0 comments


ChartBrief 186 - Bear Market Indicator
Don't let the title put you off, this bear market warning indicator is actually giving the all clear. This chart featured in the first...
Callum Thomas
Feb 7, 20181 min read
336 views
0 comments

ChartBrief 184 - China Manufacturing vs Consumer
The latest official PMI data out of China showed a slowing of momentum in the manufacturing sector (51.3 in January vs 51.6 in Dec and a...
Callum Thomas
Jan 31, 20183 min read
139 views
0 comments

The Age of Expensiveness
If it seems like just about every asset class is expensive, then you're probably paying good attention to reality. Our indicators show a...
Callum Thomas
Jan 29, 20182 min read
419 views
0 comments
VIDEO: Active Asset Allocation in 2018
In this video we talk through a set of slides presenting a top-down perspective on Active Asset Allocation in 2018. In the first part of...
Topdown Charts
Jan 23, 20181 min read
106 views
0 comments

Copper Stocks Don't Buy The Rally
Something interesting has been going on in one of our commodity intermarket models. While the price of copper has surged back from the...
Callum Thomas
Jan 22, 20182 min read
170 views
0 comments
bottom of page