top of page

Search

Callum Thomas
Feb 23, 20183 min read
ChartBrief 189 - Global Trade Update
A few data points have come out on global trade over the past week so it's worth taking a look at what has been a really key theme for...
236 views0 comments

Callum Thomas
Feb 21, 20182 min read
ChartBrief 188 - DM Mfg PMIs and UST 10Y
In case you didn't get that, it's Developed Markets manufacturing PMI (Purchasing Managers Index) and US 10-Year government bond yields. ...
130 views0 comments
Topdown Charts
Jan 12, 20182 min read
Weekly Macro Themes - 12 Jan 2018
Here's a brief preview of the topics and charts covered in the latest edition of the Weekly Macro Themes report. To read more and see the...
147 views0 comments

Callum Thomas
Jan 10, 20182 min read
ChartBrief 177 - The fourth Bond tantrum
US 10-Year Bond Yields have moved through a number of key levels and are on the cusp of a major breakout. Regular readers know by now...
385 views0 comments

Callum Thomas
Jan 5, 20183 min read
ChartBrief 176 - EM vs DM Macro and Markets
With the December round of PMI data just released, it's a good time to take a look at some of the key macro and market metrics for...
402 views0 comments

Callum Thomas
Jan 1, 20183 min read
The Charts to Watch in 2018
I spent a lot of time in the 2017 End of Year Special Edition looking back across 2017. I covered some of my best charts and...
954 views0 comments

Callum Thomas
Dec 25, 20173 min read
My Favorite Charts of 2017
Last week I put the finishing touches on the 2017 End of Year Special Edition of the Weekly Macro Themes report - something which is fast...
605 views0 comments

Callum Thomas
Dec 20, 20172 min read
ChartBrief 175 - US 10-year Bond Yields about to go to 3.5%?
A couple of things are happening in the bond space right now. Last week we got the flash PMIs for the major DM economies, and all fronts...
299 views0 comments
Topdown Charts
Dec 15, 20172 min read
Weekly Macro Themes - 15 Dec 2017
Here's a brief preview of the topics and charts covered in the latest edition of the Weekly Macro Themes report. To read more and see the...
158 views0 comments

Callum Thomas
Dec 13, 20172 min read
ChartBrief 173 - Fed Hikes, What's Next
Much as I expected (given the progression of the data) the Fed hiked again in its December meeting [and in the background continues to...
188 views0 comments

Callum Thomas
Dec 12, 20172 min read
ChartBrief 172 - When does "so good" become "too good"?
As the global economic cycle heats up, it's worth posing the question: when does "so good" become "too good"? It's a reference to one of...
303 views0 comments

Callum Thomas
Dec 11, 20172 min read
Expect more volatility?
Globally equity volatility is low. For that matter, volatility (both implied and realized) is low across the major asset classes. But...
220 views0 comments

Callum Thomas
Dec 5, 20173 min read
Crypto Charting: 5 fascinating charts that put the rise of Bitcoin in perspective
Whether it's a bubble, or viral adoption, or something else, I think most would agree that the rise of Bitcoin and cryptocurrencies in...
1,477 views0 comments

Callum Thomas
Nov 27, 20172 min read
Europhoria - What hot economic sentiment in Europe means for markets
The latest round of PMI data for Europe reflected what we're seeing across the economic sentiment indicators for the Eurozone: i.e. the...
134 views0 comments

Callum Thomas
Nov 27, 20172 min read
ChartBrief 167 - The Extraordinary Plunge in Stockmarket Volatility
Regular readers and followers on social media will be familiar with this chart, but what will probably be surprising is how this...
240 views0 comments
Topdown Charts
Nov 25, 20172 min read
Weekly Macro Themes - 24 Nov 2017
Here's a brief preview of the topics and charts covered in the latest edition of the Weekly Macro Themes report. To read more and see the...
120 views0 comments

Callum Thomas
Nov 16, 20172 min read
ChartBrief 166 - Bonds through the Cycle
The topic of the yield curve is one that has been coming up a lot lately, particularly as the 10s minus 2s spread has dipped to the...
320 views0 comments

Callum Thomas
Oct 26, 20172 min read
Passive Investors Beware of Lopsidedness
A curious trend has emerged within one of the world's major equity benchmarks: the S&P500. As passive or index investors should be well...
181 views0 comments
Topdown Charts
Oct 25, 20171 min read
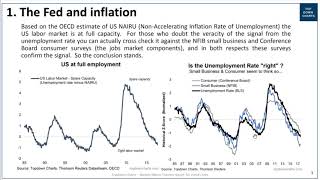
VIDEO: The Fed, Inflation, and Full Employment
In this video we look at the Fed, inflation and full employment. Specifically, the video walks you through a couple of slides of a...
83 views0 comments
Topdown Charts
Oct 18, 20171 min read
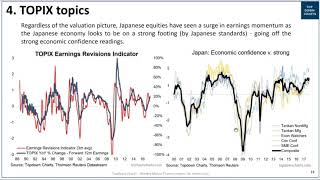
VIDEO: TOPIX and the Japanese Yen
In this video we look at the outlook for Japanese equities along with the view on the Japanese Yen and how it ties in with the...
122 views0 comments
bottom of page