top of page

Search

Callum Thomas
Jul 13, 20171 min read
ChartBrief 107 - China money growth monitor
The June money supply and credit stats out of China confirmed a couple of important trends that we've previously identified. The first...
237 views0 comments

Callum Thomas
Jul 12, 20172 min read
ChartBrief 106 - Bank of Canada hikes rates
The Bank of Canada has joined the Fed in embarking on the road to monetary policy normalization, hiking the benchmark monetary policy...
74 views0 comments

Callum Thomas
Jul 11, 20172 min read
ChartBrief 104 - Optimism running high on the US economy
The June round of economic confidence surveys on the US economy is basically done and the results show optimism is still running high. I...
75 views0 comments

Callum Thomas
Jul 10, 20172 min read
ChartBrief 102 - China inflation surprises, commodities, and EM
The latest inflation figures out of China weren't much to talk about on the face of it, with CPI at 1.5% yoy in June and PPI at 5.5% -...
110 views0 comments

Callum Thomas
Jun 27, 20172 min read
ChartBrief 89 - The search for yield continues
If the amount of AUM in yield and income related ETFs is anything to go by, it would seem that the search for yield is alive and well. ...
277 views0 comments
Topdown Charts
Jun 25, 20171 min read
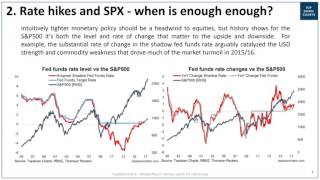
VIDEO: When is enough enough for the S&P500?
In this video we discuss the outlook for interest rates and the S&P500. The video focuses on a topic from a recent edition of the Weekly...
93 views0 comments

Callum Thomas
Jun 20, 20172 min read
Fed policy still in the "sweet spot" for stocks
Whether it's "3 steps and a stumble" or just the fact that the Fed is thinking and talking about going from QE to QT, there is a growing...
117 views0 comments
Topdown Charts
Jun 16, 20172 min read
Weekly Macro Themes - 16 June 2017
Here's a brief preview of the topics and charts covered in the latest edition of the Weekly Macro Themes report. To read more and see the...
297 views0 comments

Callum Thomas
Jun 15, 20172 min read
ChartBrief 85 - Are we all wrong about volatility?
A number of commentators have pointed out the divergence between economic policy uncertainty indexes and the VIX or equity volatility. ...
169 views0 comments

Callum Thomas
Jun 13, 20172 min read
ChartBrief 84 - Know this chart, know the Fed
With the FOMC meeting underway at the time of writing, it's worth going through one of my favorite #FedCharts - and it is one that in my...
242 views0 comments

Callum Thomas
May 3, 20171 min read
ChartBrief 76 - Wobbles in global growth
While the manufacturing PMIs are notoriously volatile series month-to-month, they give us the most timely and relatively high frequency...
177 views0 comments

Callum Thomas
May 1, 20172 min read
A Chart for Gold Bugs and Bashers alike
This week I thought I would focus on a particularly interesting chart for the outlook for the gold price. I think it is particularly...
198 views0 comments


Callum Thomas
Mar 20, 20172 min read
ChartBrief 63 - Rate hikes vs the market
Well it looks like the Fed’s rate hiking cycle is finally underway in earnest this time, with the March hike making the chart of interest...
137 views0 comments
Topdown Charts
Mar 17, 20171 min read
Weekly Macro Themes - 17 Mar 2017
Here's a brief preview of the topics and charts covered in the latest Weekly Macro Themes report. To read more and see the charts just...
219 views0 comments


Callum Thomas
Mar 7, 20172 min read
ChartBrief 59 - The Fed Sweet Spot Indicator
This chart comes from the latest edition of the Weekly Macro Themes in which I talked about why another Federal Reserve rate hike is...
159 views0 comments
Topdown Charts
Mar 4, 20171 min read
Weekly Macro Themes - 3 Mar 2017
Here's a brief preview of the topics and charts covered in the latest Weekly Macro Themes. To read more and see the charts just get in...
238 views0 comments
Topdown Charts
Feb 20, 20171 min read
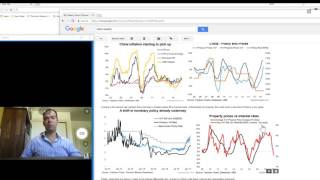
VIDEO: The Shift in Chinese Monetary Policy
In this video I show you one of the key pieces in the latest edition of the Weekly Macro Themes. Aside from addressing the important...
55 views0 comments

Callum Thomas
Feb 14, 20171 min read
ChartBrief #55 - Inflation and Monetary Policy in China
China reported its January inflation numbers: CPI 2.5% y/y vs 2.4% expected, 2.1% previous, and PPI 6.9% y/y vs 6.6% consensus, 5.5% in...
104 views0 comments

Topdown Charts
Jan 18, 20171 min read
ChartBrief #47 Eurozone inflation (surprise)
The European Central Bank meets today/tonight depending where you're reading! One thing that will be on their mind, whether they admit...
144 views0 comments

Callum Thomas
Jan 17, 20172 min read
ChartBrief #44 New Zealand stock market
Here's a couple of comments and charts on a market you may not have even thought about before. Before we dive into it, I should take the...
75 views0 comments
bottom of page