Here's the regular quick draw 5 macro technical charts (going as far as individual commodities, currencies, bonds, and sectors, as well as the rest of the major indexes and benchmarks). No comments on anything except the technical/price developments. Even if you're not technical analysis minded it's a useful way to keep on top of trends in some of the main financial markets and as a prompt for further investigation...
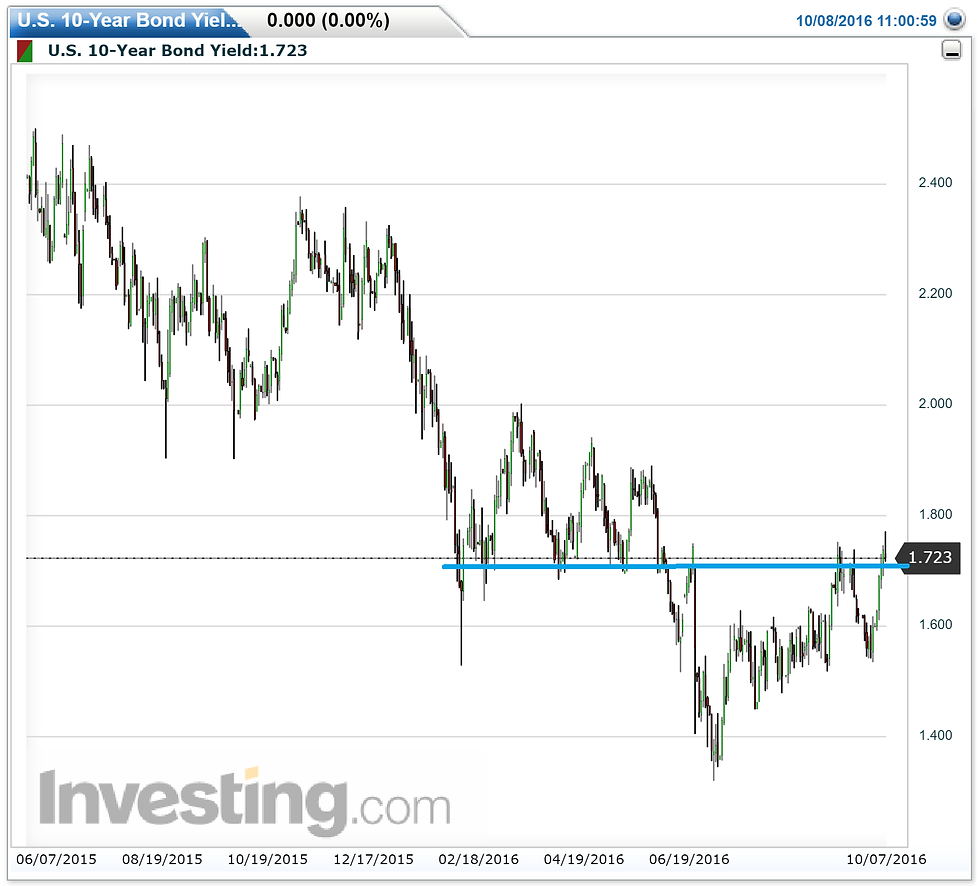
1. US 10 Year Treasury - Breakout
-The US 10 year bond yield has broken though resistance of 1.70%.
-It's also now gone above the 50 day and 200 day moving averages.
-At this point you would expect it to go all the way towards the 2% level.
Overall technical view: Expect higher bond yields short term (bearish bonds)

2. US REITs - Breaking down
-A logical after effect of the previous chart; REITs continue to trade closely with treasuries, and that is bad news for the "newest sector" of the S&P500.
-REITs are on the verge of breaking down through their 200 day moving average - a key trigger to watch.
-REIT relative performance has already broken down, and further underperformance should be expected.
Overall technical view: Bearish, particularly if the 200 day moving average goes.

3. WTI Crude Oil - Breakout
-In a previous report I alerted readers to the bearish case for oil but noted that if the red line was crossed the best thing to do would be to just go with the breakout.
-And breakout it has, after breaking the minor downtrend line it's breached the $50 a barrel mark.
-Before you start celebrating, note that previous runs failed around $50, so it would be best to look for a break though $52 before gaining conviction on a run to the next target of $60.
Overall technical view: Bullish; breakout potentially puts $60 level in play.

4. USDCNH - Another breakout
-USDCNH had been forming a triangle pattern, and has now broken out to the upside.
-USDCNH has also broken through the 6.70 "line in the sand", and thus will likely go further.
-Simple measure rule would say it will likely be at least a 0.10 move, so it would not be surprising to see it go all the way to 6.80, which would bring the very significant 2008 re-peg level of 6.83 in to play.
Overall technical view: Expect USDCNH to move higher after an upside break of the triangle and key 6.70 level.

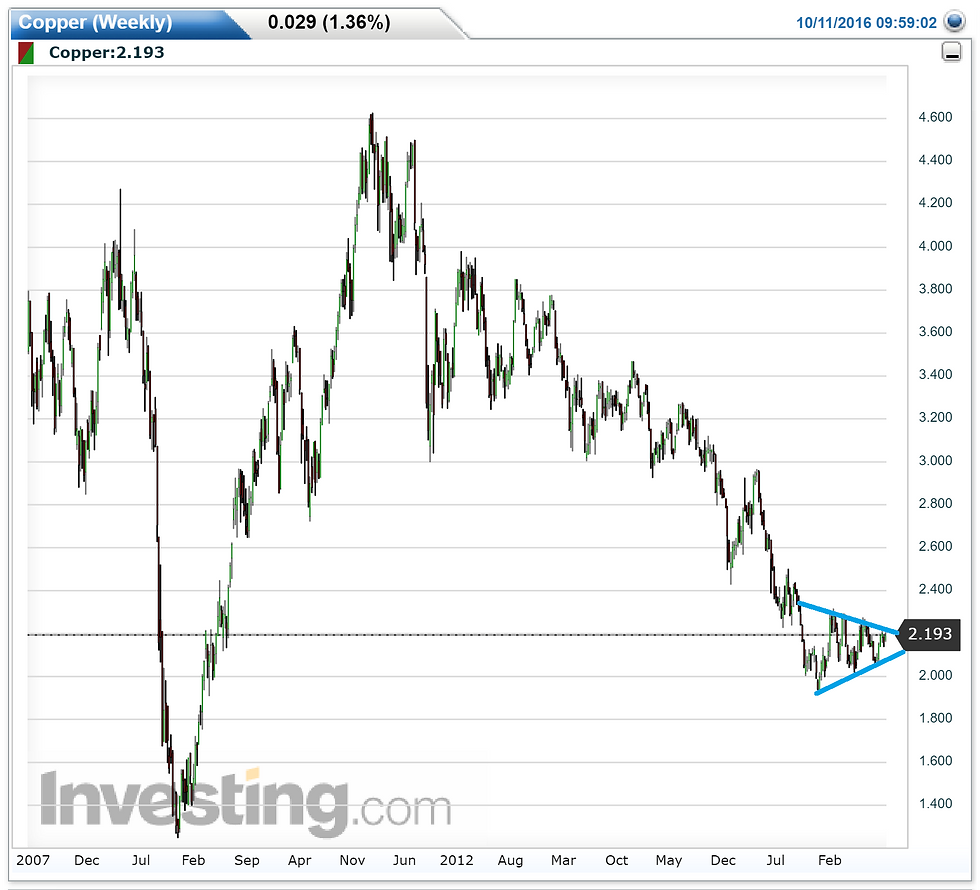
5. Copper - Triangle
-While the previous setups were all breakouts, here's one that is still yet to break.
-Copper is putting in a meaningfully large triangle pattern on the weekly chart that comes at what looks like may be the end of a major downtrend.
-Still need to wait for the break and go with the breakout; it could still just as easily be a continuation pattern (of the downtrend) as a reversal pattern that could mark the start of a new uptrend.
Overall technical view: Bullish bias, but wait for the break and go with it.

Thanks to Investing.com and StockCharts.com and BarChart.com for charts.
Previous editions:
